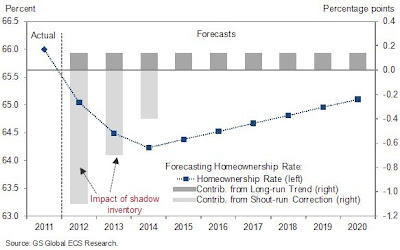
The banking system is starting to clear out shadow inventory and nationwide, prices are inching closer to a nominal bottom.? It is important to understand how crucial a healthy housing market is for the stability of household balance sheets.? Most Americans derive the bulk of their net worth from housing.? The fact that nearly 10,000,000 Americans are underwater is a major drag for the economy moving forward.? Goldman Sachs recently released a study looking at the housing market and attempted to analyze a bottom in regards to the homeownership rate.? One of their major key figures dragging the rate lower was of course, the shadow inventory.? Certainly banks can leak out properties via a variety of mechanism through short sales, REOs, rent-to-own programs, and bulk sales to big investors.? The ?throw everything at the wall? approach is likely to be the status quo for the housing market moving forward.
Homeownership forecast bottom at 2014
The drag of distressed inventory is definitely being felt in the homeownership arena.? Think about what is happening right now.? Over a decade of stagnant income and weak employment growth has created a major gap in the demand for housing.? On one side, you have new household formation but many younger families are less affluent than the big baby boomer cohort that owns a good portion of current housing.? The younger families are demanding lower priced homes and baby boomers are looking to cash out at higher prices.? The gap is created especially with so many legacy loans still priced at face value peak prices.? The report put out by Goldman Sachs understands this drag being created by the shadow inventory:

In other words, the biggest pull to the downside for the next three years is going to be the shadow inventory.? So let us review the mechanisms in which shadow inventory is being cleared out:
-1.? Short sales
-2.? REOs
-3.? Rent-to-own programs
-4.? Bulk sales to investors
-5.? Controlled low rate mortgage programs to help aid people underwater (i.e., HARP 2.0 etc)
All these programs essentially are part of the buffet to rectify the value disconnection brought on by the housing bubble.? Yet where does the income or employment growth come from?? The demographic question is important and crucial to understand.? We also have data that simply does not measure reality.? For example, in the latest data the California unemployment rate fell from 11 to 10.9 percent but in the process lost 4,200 jobs.? This happens because people are dropping out of the labor force.? Did the pool of qualified potential home buyers just increase?? Unlikely.? This is why with interest rates in the insane 3% range home values are still just bouncing along the bottom and sales are simply moving sideways.
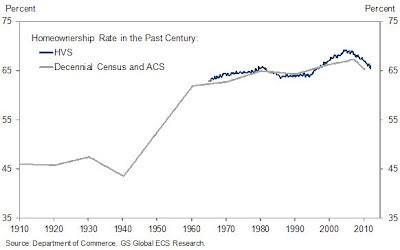
With a bottom in 2014 we would be back to the homeownership rate last seen 20 years ago:

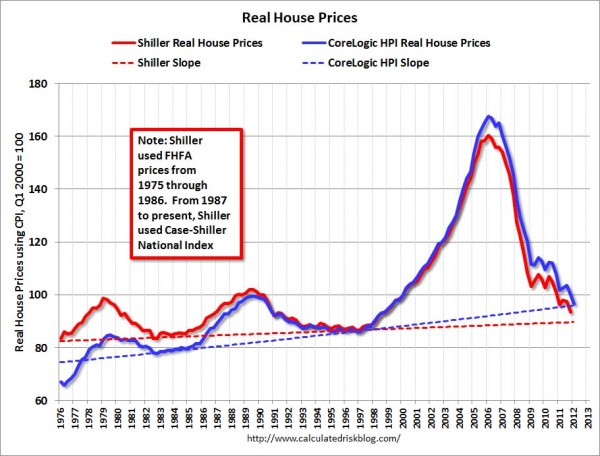
Is this a positive development?? Since the Great Depression housing has been the bedrock for wealth for most Americans deep into retirement.? So this decline is likely to make it tougher for most to build wealth since very few Americans actually own any sizable amount of stocks or bonds for that matter.? Even at the 2014 estimated bottom, some 64 percent of Americans will be considered homeowners.? That is a sizable portion but lower from where we are even today.? At retirement many can rest assured (assuming they paid off their mortgage) that their home is now fully owned or can go for a reverse mortgage if they are on the verge of eating off the dollar menu at McDonalds.? It is troubling that the projections for Social Security not being able to pay out full benefits hits when many of these younger buyers will enter into their own retirement although their rate of paying into the system is the highest on record.? The scary thing is that as we enter the peak of baby boomer retirements, the housing market is at its nadir in terms of price:

Real home prices adjusting for inflation are back to levels last seen in 1997.? Japan has faced over two lost decades and we are well into our second lost decade in terms of prices and homeownership rates.? Obviously each market is unique in its own respects and the above is merely looking at the nation as a whole.? For well over a year I have mentioned that it is likely that nationwide we are reaching a bottom with the median home price being $163,000 and the typical household pulling in $50,000.? Historically this seems to work fine and given current mortgage rates, there are many good deals to be had across the country.? Yet many areas including many cities in California are still in micro-bubbles.
The comparison with Japan is apt in the following ways:
-Quantitative easing and major central bank action to keep interest rates artificially low after a housing bubble
-Younger less affluent generation needing to support older generation
-Home values losing a decade or more of worth (real adjusted prices)
Every country is different obviously but this push for a lower homeownership rate is going to come because of lingering distressed inventory but also, a new home buyer that is less affluent than the previous baby boomer generation.? Is it any wonder why so many young college graduates and younger folks are moving back home with mom and dad after being on their own?? Many of these actually are working in part-time gigs pulling in some income but certainly not enough to buy a home and in many cases, not even enough to rent a place of their own.? The above charts merely reflect this sobering trend.
 Did You Enjoy The Post? Subscribe to Dr. Housing Bubble?s Blog to get updated housing commentary, analysis, and information.
padma lakshmi daughtry lakers trade ann arbor news ides of march elizabeth smart nick young
No comments:
Post a Comment
Note: Only a member of this blog may post a comment.